
If your procurement team still relies on static dashboards, siloed spreadsheets, and month-end reconciliation to understand spend performance, you’re not alone, and you’re not getting the visibility you need to act in real time. This guide walks through how the new Procurement Analytics module in ewiz procure is architected to solve that problem, and how procurement leaders can use it to move from fragmented reporting to centralized, real-time decision-making.
Why traditional procurement reporting falls short
Before looking at the solution, it’s worth diagnosing the root problem. Most procurement analytics setups today suffer from four structural issues:
- Static dashboards with no real-time data refresh, meaning decisions are made on stale information
- Fragmented KPIs scattered across business units, geographies, and disconnected tools
- Manual reconciliation of cost baselines against realized savings, which is slow and error-prone
- Blind spots in supplier performance and ESG compliance tracking
The net effect: leaders can’t reliably connect day-to-day procurement activity to enterprise-level impact.
As Vera Rozanova, Procurement Transformation Advisor, puts it:
“Insights don’t mean anything unless they drive action. And that action needs to be in context, across markets, teams, and timelines.”
The technical approach: What the procurement analytics module does
The module is built to give procurement leaders a centralized, intelligent, and actionable view across all procurement activities, whether you’re managing thousands of SKUs, global supplier ecosystems, or high-stakes sourcing decisions. Here’s how it’s structured functionally:
Real-Time Trend Analysis
The system continuously analyzes trends across categories, regions, and suppliers, rather than relying on periodic batch reporting.
Role-Based Dashboards
Spend insights, performance KPIs, and risk alerts are visualized through dashboards tailored to different roles — so a category manager and a CPO see the data relevant to their decisions, not a one-size-fits-all report.
Anomaly Detection
The module flags irregularities automatically, including:
- Pricing variance outside expected thresholds
- Non-compliant purchases
- Missed SLAs
AI-Driven Decision Support
Rather than functioning as a static dashboard, the module applies AI-driven insights to help answer high-stakes questions such as:
- Are we actually realizing the savings we planned?
- Where is compliance slipping?
- Which suppliers are creating or destroying value?
- Which categories are ripe for consolidation or renegotiation?
The ewiz procure approach: Analytics that drives decisions
Built for speed, scale, and CPO-level visibility, the new analytics module in ewiz procure turns complexity into clarity.
🎥 See it in action:
Check out the walkthrough of a dashboard from the new Procurement Analytics module:
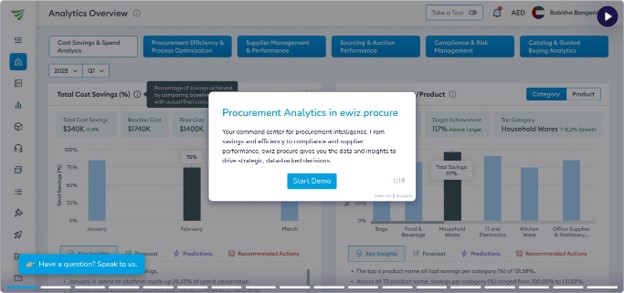
Click here to check out the full demo.
Here’s what it delivers:
Cost savings intelligence
- Track actual vs. planned savings in real time
- View baseline vs. final negotiated prices
- Analyze by supplier, category, project, or geography
- Spot opportunities for bundling and renegotiation
Category and SKU insights
- See which categories are growing or underperforming
- Drill down into SKU-level volume trends
- Forecast demand and benchmark across locations
Compliance and policy tracking
- Flag purchases outside approved vendors or specs
- Monitor ESG alignment and carbon impact scores
- Identify contract leakage and maverick spend
Supplier performance metrics
- Track SLA adherence, delays, and issue resolution
- Score vendors on quality, sustainability, and pricing consistency
- Identify underperforming suppliers for review
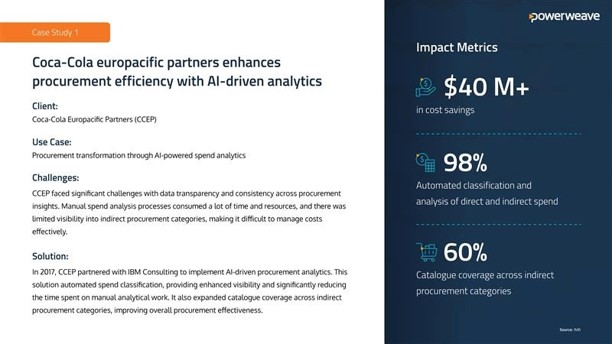
Adoption in Action: Coca-Cola Europacific Partners’ success story
Here’s how Coca-Cola Europacific Partners used AI-powered analytics to unify fragmented spend data across 30 countries and standardize reporting, leading to sharper sourcing decisions and measurable ROI.
Want to explore more success stories and use cases?
This is one of 5 use cases and 10 real-world stories featured in our AI in Procurement Guide.
Download the guide for more enterprise-ready use cases and results
Whether you’re building your first business case or scaling your third AI initiative, this guide helps connect action to ROI.
Beyond Procurement by Powerweave
We help enterprises rethink procurement and sustainability with purpose-built modular solutions like ewiz procure and Snowkap.
If you’re evaluating how a centralized analytics layer could fit into your procurement stack, the next step is a direct conversation rather than a generic pitch. You can book a free discovery call with the Beyond Procurement team to walk through what this could look like for your organization.
Want to explore what this could mean for your team or where to start?
No pitch decks, just a real conversation.
